Asset Management Dashboard |
|

Note: This option is only available if Asset Management is activated in the Admin area.
Depending on your access, and if the Asset Management nav button is visible in the Masthead, you will see a dashboard showing the following items*:
- Number of Active Assets
- Number of clients with Active Assets
- Number of Locations with Active Assets
- Open tickets linked to Assets
If you have permissions in Revelation to add an asset, simply right click on the Assets button in the main nav. You'll be taken to the form to add your asset.
|
The colored squares on the dashboard show how many items are in each of the main asset categories. The default categories are Devices, Operating Systems, Processors and Manufacturers/Models. This may be different in your system, if the phrases have been changed in the Admin area.
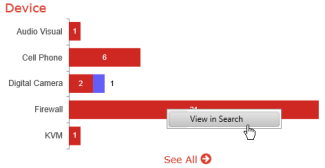
The bar charts below these squares will show the top five items in each category. The first number is the total number of items in the category. If the bar has a different color on the end and a number, it is showing the number of open tickets for the item.
Click on any bar to get a View in Search option.
Ticket State By (Item) provides a bar chart of the open tickets associated with assets in the system. The colors match the ticket state in Revelation. A green bar is a new ticket, a blue bar is a good ticket, etc. Click on the bar to be taken to Search to show the tickets.
Clicking on the "See All" icon at the bottom of each chart will take you to the complete listing.
Map View brings in mapping, showing markers representing open tickets which are tied to active assets.
*Your view will depend on restrictions set in the Ticket Access Control by your Administrator. |
|